OpenVINO™ を使用した 3D 点群パーツのセグメント化
この Jupyter ノートブックはオンラインで起動でき、ブラウザーのウィンドウで対話型環境を開きます。ローカルにインストールすることもできます。次のオプションのいずれかを選択します。


このノートブックでは、点群データを処理し、OpenVINO で 3D パーツのセグメント化を実行する方法を説明します。PointNet の事前トレーニング済みモデルを使用して椅子の各パーツを検出し、そのカテゴリーを返します。
PointNet
PointNet は、2016 年にスタンフォード大学の研究者 Charles Ruizhongtai Qi によって提案されました: PointNet: 3D 分類およびセグメント化のための点セットに関するディープラーニング。研究の目的は、画像の 3D 表現を分類してセグメント化することです。これらは、3D 形状またはオブジェクトを表す点のセットである点群と呼ばれるデータ構造を使用します。PointNet は、オブジェクトの分類、パーツのセグメント化、シーンのセマンティック解析に至るまでのアプリケーションに統合アーキテクチャーを提供します。非常に効率的かつ効果的で、最先端技術と同等、またはそれ以上の強力なパフォーマンスを示します。
目次
%pip install -q "openvino>=2023.1.0"
DEPRECATION: pytorch-lightning 1.6.5 has a non-standard dependency specifier torch>=1.8.*. pip 24.1 will enforce this behaviour change. A possible replacement is to upgrade to a newer version of pytorch-lightning or contact the author to suggest that they release a version with a conforming dependency specifiers. Discussion can be found at https://github.com/pypa/pip/issues/12063
Note: you may need to restart the kernel to use updated packages.
インポート
from pathlib import Path
from typing import Union
import numpy as np
import matplotlib.pyplot as plt
import openvino as ov

# Fetch `notebook_utils` module
import urllib.request
urllib.request.urlretrieve(
                                    url='https://raw.githubusercontent.com/openvinotoolkit/openvino_notebooks/main/notebooks/utils/notebook_utils.py',
    filename='notebook_utils.py'
)

from notebook_utils import download_file
モデルの準備
事前トレーニングされた PointNet ONNX モデルをダウンロードします。この事前トレーニング済みモデルは axinc-ai で提供されており、その他の点群の例はこちらで見つけることができます。
# Set the data and model directories, model source URL and model filename
MODEL_DIR = Path("model")
MODEL_DIR.mkdir(exist_ok=True)
download_file("https://storage.googleapis.com/ailia-models/pointnet_pytorch/chair_100.onnx", directory=Path(MODEL_DIR), show_progress=False)
onnx_model_path = MODEL_DIR / "chair_100.onnx"
ONNX モデルを OpenVINO IR に変換します。OpenVINO IR (中間表現) モデルは、ネットワーク・トポロジーに関する情報を含む .xml ファイルと、重みとバイアスのバイナリーデータを含む .bin ファイルで構成されます。モデル変換 Python API は、ONNX モデルから OpenVINO IR への変換に使用されます。ov.convert_model Python 関数は、デバイスにロードして予測を開始できる状態の OpenVINO モデルを返します。ov.save_model を使用して、次回使用するためディスクに保存できます。モデル変換 Python API の詳細については、このページを参照してください。
ir_model_xml = onnx_model_path.with_suffix(".xml")

core = ov.Core()

if not ir_model_xml.exists():
    # Convert model to OpenVINO Model
    model = ov.convert_model(onnx_model_path)
    # Serialize model in OpenVINO IR format xml + bin
    ov.save_model(model, ir_model_xml)
else:
    # Read model
    model = core.read_model(model=ir_model_xml)
データ処理モジュール
def load_data(point_file: Union[str, Path]):
    """
    Load the point cloud data and convert it to ndarray

    Parameters:
        point_file: string, path of .pts data
    Returns:
       point_set: point clound represented in np.array format
    """

    point_set = np.loadtxt(point_file).astype(np.float32)

    # normailization
    point_set = point_set - np.expand_dims(np.mean(point_set, axis=0), 0)  # center
    dist = np.max(np.sqrt(np.sum(point_set ** 2, axis=1)), 0)
    point_set = point_set / dist  # scale

    return point_set


def visualize(point_set:np.ndarray):
    """
    Create a 3D view for data visualization

    Parameters:
        point_set: np.ndarray, the coordinate data in X Y Z format
    """

    fig = plt.figure(dpi=192, figsize=(4, 4))
    ax = fig.add_subplot(111, projection='3d')
    X = point_set[:, 0]
    Y = point_set[:, 2]
    Z = point_set[:, 1]

    # Scale the view of each axis to adapt to the coordinate data distribution
    max_range = np.array([X.max() - X.min(), Y.max() - Y.min(), Z.max() - Z.min()]).max() * 0.5
    mid_x = (X.max() + X.min()) * 0.5
    mid_y = (Y.max() + Y.min()) * 0.5
    mid_z = (Z.max() + Z.min()) * 0.5
    ax.set_xlim(mid_x - max_range, mid_x + max_range)
    ax.set_ylim(mid_y - max_range, mid_y + max_range)
    ax.set_zlim(mid_z - max_range, mid_z + max_range)

    plt.tick_params(labelsize=5)
    ax.set_xlabel('X', fontsize=10)
    ax.set_ylabel('Y', fontsize=10)
    ax.set_zlabel('Z', fontsize=10)

    return ax
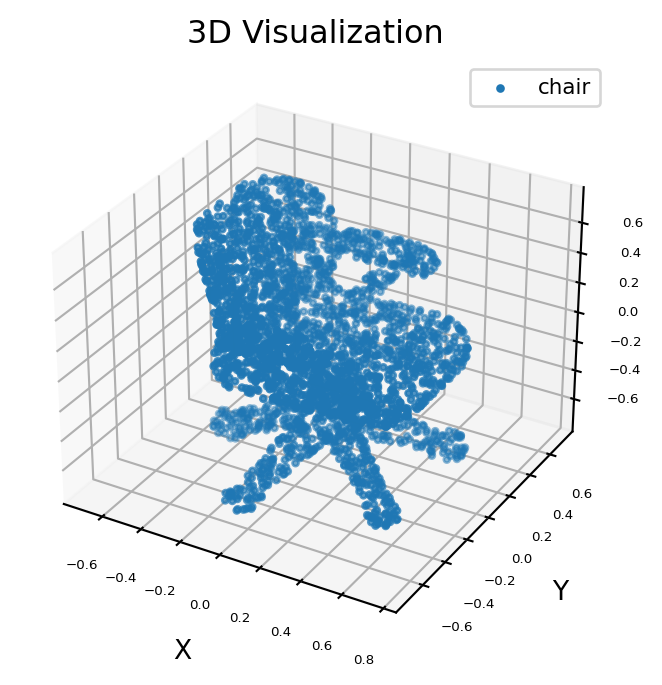
元の 3D データを可視化
点群データは、3D 形状の大規模データセットである ShapeNet からダウンロードできます。ここでは例として椅子の 3D データを選択します。
# Download data from the openvino_notebooks storage
point_data = download_file(
    "https://storage.openvinotoolkit.org/repositories/openvino_notebooks/data/data/pts/chair.pts",
    directory="data"
)

points = load_data(str(point_data))
X = points[:, 0]
Y = points[:, 2]
Z = points[:, 1]
ax = visualize(points)
ax.scatter3D(X, Y, Z, s=5, cmap="jet", marker="o", label='chair')
ax.set_title('3D Visualization')
plt.legend(loc='upper right', fontsize=8)
plt.show()
data/chair.pts: 0%| | 0.00/69.2k [00:00<?, ?B/s]
/tmp/ipykernel_2848921/2347079344.py:12: UserWarning: No data for colormapping provided via 'c'. Parameters 'cmap' will be ignored
    ax.scatter3D(X, Y, Z, s=5, cmap="jet", marker="o", label='chair')
推論の実行
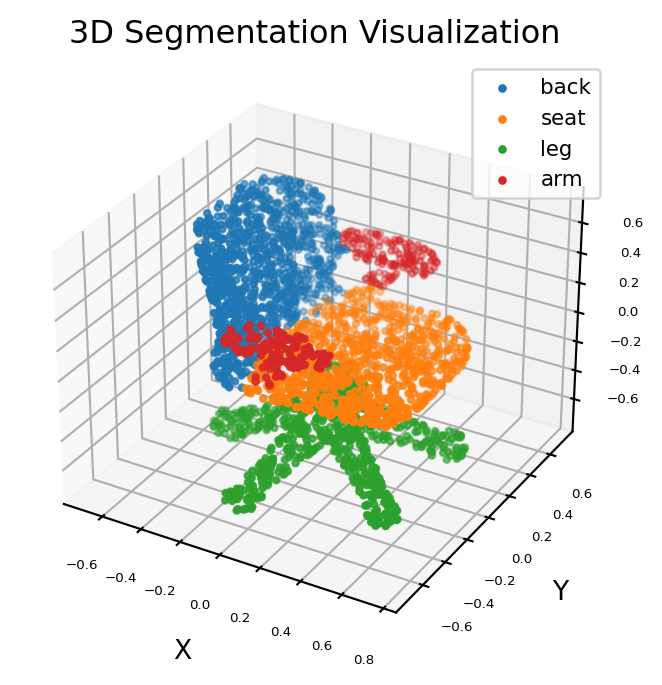
推論を実行し、3D セグメント化の結果を視覚化します。
- 3D セグメント化の結果を視覚化しま入力データは、1 バッチサイズ、3 軸値 (x、y、z) および任意の数の点 (動的形状) を持つ点群です。
- 出力データは、入力ポイントごとに 1 つのバッチサイズと 4 つの分類信頼度を持つマスクです。
# Parts of a chair
classes = ['back', 'seat', 'leg', 'arm']

# Preprocess the input data
point = points.transpose(1, 0)
point = np.expand_dims(point, axis=0)

# Print info about model input and output shape
print(f"input shape: {model.input(0).partial_shape}")
print(f"output shape: {model.output(0).partial_shape}")
input shape: [1,3,?]
output shape: [1,?,4]
OpenVINO を使用して推論を実行するためにドロップダウン・リストからデバイスを選択します。
import ipywidgets as widgets

device = widgets.Dropdown(
    options=core.available_devices + ["AUTO"],
    value='AUTO',
    description='Device:',
    disabled=False,
)

device
Dropdown(description='Device:', index=1, options=('CPU', 'AUTO'), value='AUTO')
# Inference
compiled_model = core.compile_model(model=model, device_name=device.value)
output_layer = compiled_model.output(0)
result = compiled_model([point])[output_layer]

# Find the label map for all points of chair with highest confidence
pred = np.argmax(result[0], axis=1)
ax = visualize(point)
for i, name in enumerate([0, 1, 2, 3]):
    XCur = []
    YCur = []
    ZCur = []
    for j, nameCur in enumerate(pred):
    if name == nameCur:
    XCur.append(X[j])
    YCur.append(Y[j])
    ZCur.append(Z[j])
    XCur = np.array(XCur)
    YCur = np.array(YCur)
    ZCur = np.array(ZCur)

    # add current point of the part
    ax.scatter(XCur, YCur, ZCur, s=5, cmap="jet", marker="o", label=classes[i])

ax.set_title('3D Segmentation Visualization')
plt.legend(loc='upper right', fontsize=8)
plt.show()
/tmp/ipykernel_2848921/68687822.py:23: UserWarning: No data for colormapping provided via 'c'. Parameters 'cmap' will be ignored
    ax.scatter(XCur, YCur, ZCur, s=5, cmap="jet", marker="o", label=classes[i])