産業用メーター読み取り
この Jupyter ノートブックはオンラインで起動でき、ブラウザーのウィンドウで対話型環境を開きます。ローカルにインストールすることもできます。次のオプションのいずれかを選択します。


このノートブックでは、OpenVINO ランタイムを使用して産業用メーターリーダーを作成する方法を説明します。事前トレーニングされた PPYOLOv2 PaddlePaddle モデルと DeepLabV3P を使用して、複数の推論タスク・パイプラインを構築します。
検出モデルを実行してメーターを見つけ、元の写真からトリミングします。
これらのトリミングされたメーターに対してセグメント化モデルを実行して、ポインターとスケールのインスタンスを取得します。
スケールマップでポインターの位置を見つけます。
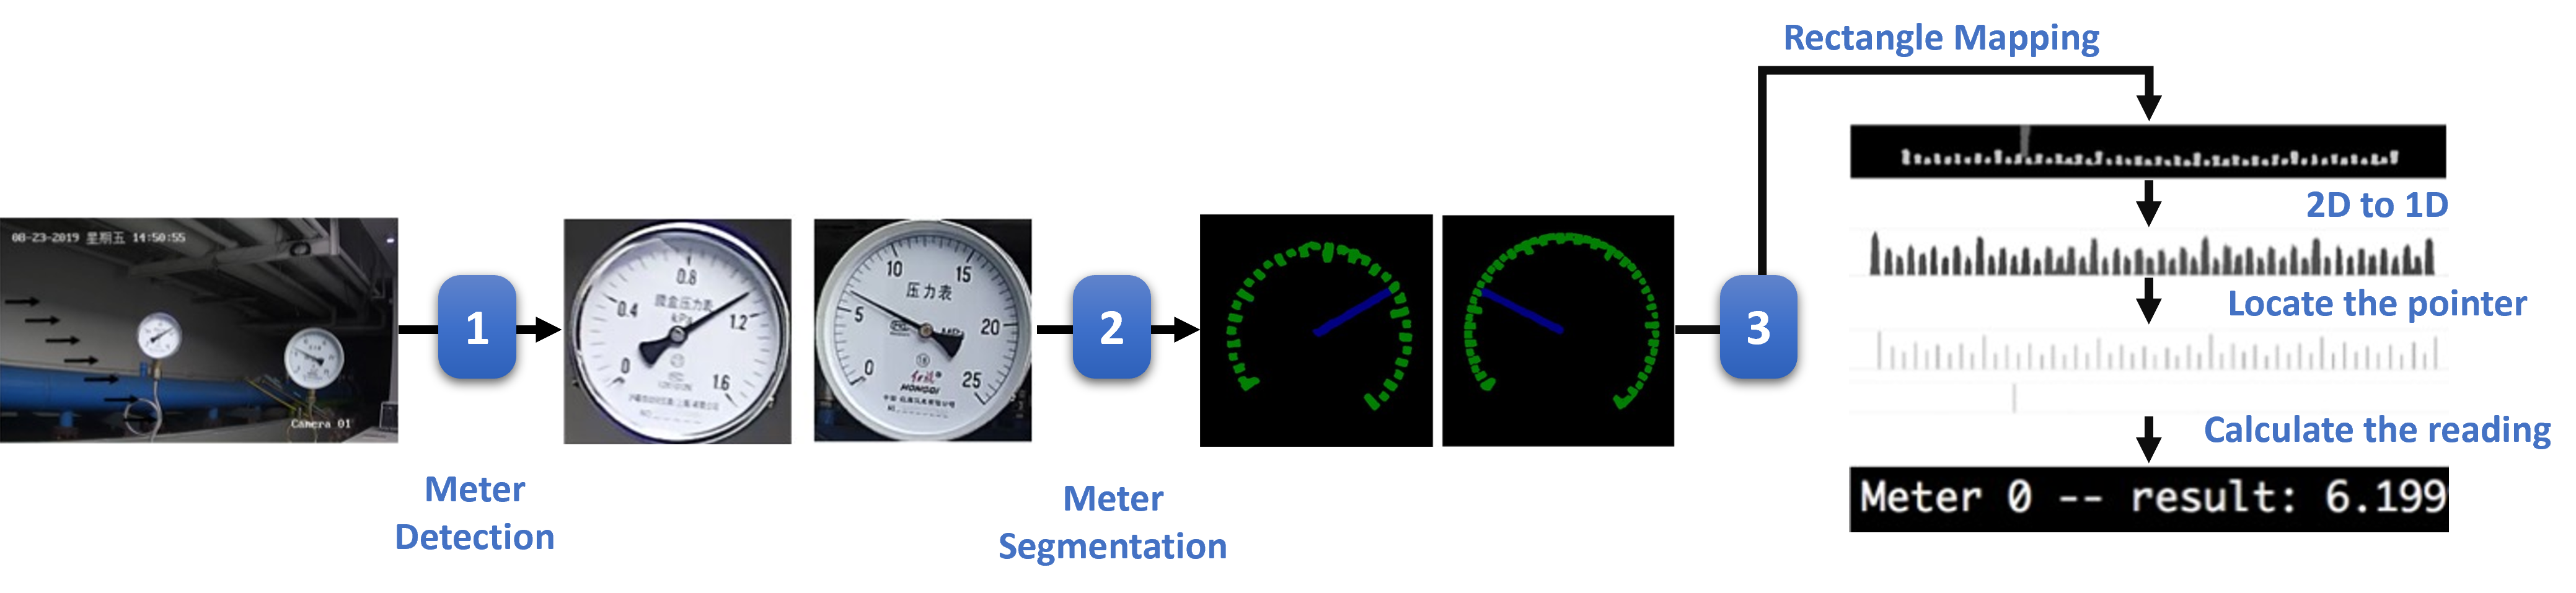
ワークフロー
目次
# Install openvino package
%pip install -q "openvino>=2023.1.0" matplotlib
Note: you may need to restart the kernel to use updated packages.
インポート
import os
import sys
from pathlib import Path
import numpy as np
import math
import cv2
import tarfile
import matplotlib.pyplot as plt
import openvino as ov

sys.path.append("../utils")
from notebook_utils import download_file, segmentation_map_to_image
モデルとテストイメージを準備
PaddlePaddle コミュニティーから PPYOLOv2 および DeepLabV3P の事前トレーニング済みモデルをダウンロードします。
MODEL_DIR = "model"
DATA_DIR = "data"
DET_MODEL_LINK = "https://storage.openvinotoolkit.org/repositories/openvino_notebooks/models/meter-reader/meter_det_model.tar.gz"
SEG_MODEL_LINK = "https://storage.openvinotoolkit.org/repositories/openvino_notebooks/models/meter-reader/meter_seg_model.tar.gz"
DET_FILE_NAME = DET_MODEL_LINK.split("/")[-1]
SEG_FILE_NAME = SEG_MODEL_LINK.split("/")[-1]
IMG_LINK = "https://user-images.githubusercontent.com/91237924/170696219-f68699c6-1e82-46bf-aaed-8e2fc3fa5f7b.jpg"
IMG_FILE_NAME = IMG_LINK.split("/")[-1]
IMG_PATH = Path(f"{DATA_DIR}/{IMG_FILE_NAME}")

os.makedirs(MODEL_DIR, exist_ok=True)

download_file(DET_MODEL_LINK, directory=MODEL_DIR, show_progress=True)
file = tarfile.open(f"model/{DET_FILE_NAME}")
res = file.extractall("model")
if not res:
    print(f"Detection Model Extracted to \"./{MODEL_DIR}\".")
else:
    print("Error Extracting the Detection model. Please check the network.")

download_file(SEG_MODEL_LINK, directory=MODEL_DIR, show_progress=True)
file = tarfile.open(f"model/{SEG_FILE_NAME}")
res = file.extractall("model")
if not res:
    print(f"Segmentation Model Extracted to \"./{MODEL_DIR}\".")
else:
    print("Error Extracting the Segmentation model. Please check the network.")

download_file(IMG_LINK, directory=DATA_DIR, show_progress=True)
if IMG_PATH.is_file():
    print(f"Test Image Saved to \"./{DATA_DIR}\".")
else:
    print("Error Downloading the Test Image. Please check the network.")
model/meter_det_model.tar.gz: 0%| | 0.00/192M [00:00<?, ?B/s]
Detection Model Extracted to "./model".
model/meter_seg_model.tar.gz: 0%| | 0.00/94.9M [00:00<?, ?B/s]
Segmentation Model Extracted to "./model".
data/170696219-f68699c6-1e82-46bf-aaed-8e2fc3fa5f7b.jpg: 0%| | 0.00/183k [00:00<?, ?B/s]
Test Image Saved to "./data".
構成
読み取り計算用のパラメーター設定を追加します。
METER_SHAPE = [512, 512]
CIRCLE_CENTER = [256, 256]
CIRCLE_RADIUS = 250
PI = math.pi
RECTANGLE_HEIGHT = 120
RECTANGLE_WIDTH = 1570
TYPE_THRESHOLD = 40
COLORMAP = np.array([[28, 28, 28], [238, 44, 44], [250, 250, 250]])

# There are 2 types of meters in test image datasets
METER_CONFIG = [{
    'scale_interval_value': 25.0 / 50.0,
    'range': 25.0,
    'unit': "(MPa)"
}, {
    'scale_interval_value': 1.6 / 32.0,
    'range': 1.6,
    'unit': "(MPa)"
}]

SEG_LABEL = {'background': 0, 'pointer': 1, 'scale': 2}
モデルのロード
モデルの読み込みと推論の共通クラスを定義します
# Initialize OpenVINO Runtime
core = ov.Core()


class Model:
    """
    This class represents a OpenVINO model object.

    """
    def __init__(self, model_path, new_shape, device="CPU"):
        """
        Initialize the model object

        Param:
            model_path (string): path of inference model
            new_shape (dict): new shape of model input

        """
        self.model = core.read_model(model=model_path)
        self.model.reshape(new_shape)
        self.compiled_model = core.compile_model(model=self.model, device_name=device)
        self.output_layer = self.compiled_model.output(0)

        def predict(self, input_image):
        """
        Run inference

        Param:
            input_image (np.array): input data

        Retuns:
            result (np.array)): model output data
        """
        result = self.compiled_model(input_image)[self.output_layer]
        return result
データ処理
各モデルの前処理タスクと後処理タスクが含まれます。
def det_preprocess(input_image, target_size):
    """
    Preprocessing the input data for detection task

    Param:
        input_image (np.array): input data
        size (int): the image size required by model input layer
    Retuns:
        img.astype (np.array): preprocessed image

    """
    img = cv2.resize(input_image, (target_size, target_size))
    img = np.transpose(img, [2, 0, 1]) / 255
    img = np.expand_dims(img, 0)
    img_mean = np.array([0.485, 0.456, 0.406]).reshape((3, 1, 1))
    img_std = np.array([0.229, 0.224, 0.225]).reshape((3, 1, 1))
    img -= img_mean
    img /= img_std
    return img.astype(np.float32)


def filter_bboxes(det_results, score_threshold):
    """
    Filter out the detection results with low confidence

    Param:
        det_results (list[dict]): detection results
        score_threshold (float):  confidence threshold

    Retuns:
        filtered_results (list[dict]): filter detection results

    """
    filtered_results = []
    for i in range(len(det_results)):
    if det_results[i, 1] > score_threshold:
    filtered_results.append(det_results[i])
    return filtered_results


def roi_crop(image, results, scale_x, scale_y):
    """
    Crop the area of detected meter of original image

    Param:
        img (np.array): original image。
        det_results (list[dict]): detection results
        scale_x (float): the scale value in x axis
        scale_y (float): the scale value in y axis

    Retuns:
        roi_imgs (list[np.array]): the list of meter images
        loc (list[int]): the list of meter locations

    """
    roi_imgs = []
    loc = []
    for result in results:
    bbox = result[2:]
    xmin, ymin, xmax, ymax = [int(bbox[0] * scale_x), int(bbox[1] * scale_y), int(bbox[2] * scale_x), int(bbox[3] * scale_y)]
    sub_img = image[ymin:(ymax + 1), xmin:(xmax + 1), :]
    roi_imgs.append(sub_img)
    loc.append([xmin, ymin, xmax, ymax])
    return roi_imgs, loc


def roi_process(input_images, target_size, interp=cv2.INTER_LINEAR):
    """
    Prepare the roi image of detection results data
    Preprocessing the input data for segmentation task

    Param:
        input_images (list[np.array]): the list of meter images
        target_size (list|tuple):  height and width of resized image, e.g [heigh,width]
        interp (int): the interp method for image reszing

    Retuns:
        img_list (list[np.array]): the list of processed images
        resize_img (list[np.array]): for visualization

    """
    img_list = list()
    resize_list = list()
    for img in input_images:
    img_shape = img.shape
    scale_x = float(target_size[1]) / float(img_shape[1])
    scale_y = float(target_size[0]) / float(img_shape[0])
    resize_img = cv2.resize(img, None, None, fx=scale_x, fy=scale_y, interpolation=interp)
    resize_list.append(resize_img)
    resize_img = resize_img.transpose(2, 0, 1) / 255
    img_mean = np.array([0.5, 0.5, 0.5]).reshape((3, 1, 1))
    img_std = np.array([0.5, 0.5, 0.5]).reshape((3, 1, 1))
    resize_img -= img_mean
    resize_img /= img_std
    img_list.append(resize_img)
    return img_list, resize_list


def erode(seg_results, erode_kernel):
    """
    Erode the segmentation result to get the more clear instance of pointer and scale

    Param:
        seg_results (list[dict]): segmentation results
        erode_kernel (int): size of erode_kernel

    Return:
        eroded_results (list[dict]):  the lab map of eroded_results

    """
    kernel = np.ones((erode_kernel, erode_kernel), np.uint8)
    eroded_results = seg_results
    for i in range(len(seg_results)):
    eroded_results[i] = cv2.erode(seg_results[i].astype(np.uint8), kernel)
    return eroded_results


def circle_to_rectangle(seg_results):
    """
    Switch the shape of label_map from circle to rectangle

    Param:
        seg_results (list[dict]): segmentation results

    Return:
        rectangle_meters (list[np.array]): the rectangle of label map

    """
    rectangle_meters = list()
    for i, seg_result in enumerate(seg_results):
    label_map = seg_result

    # The size of rectangle_meter is determined by RECTANGLE_HEIGHT and RECTANGLE_WIDTH
    rectangle_meter = np.zeros((RECTANGLE_HEIGHT, RECTANGLE_WIDTH), dtype=np.uint8)
    for row in range(RECTANGLE_HEIGHT):
    for col in range(RECTANGLE_WIDTH):
    theta = PI * 2 * (col + 1) / RECTANGLE_WIDTH

    # The radius of meter circle will be mapped to the height of rectangle image
    rho = CIRCLE_RADIUS - row - 1
    y = int(CIRCLE_CENTER[0] + rho * math.cos(theta) + 0.5)
    x = int(CIRCLE_CENTER[1] - rho * math.sin(theta) + 0.5)
    rectangle_meter[row, col] = label_map[y, x]
    rectangle_meters.append(rectangle_meter)
    return rectangle_meters


def rectangle_to_line(rectangle_meters):
    """
    Switch the dimension of rectangle label map from 2D to 1D

    Param:
        rectangle_meters (list[np.array]):2D rectangle OF label_map。

    Return:
        line_scales (list[np.array]): the list of scales value
        line_pointers (list[np.array]):the list of pointers value

    """
    line_scales = list()
    line_pointers = list()
    for rectangle_meter in rectangle_meters:
    height, width = rectangle_meter.shape[0:2]
    line_scale = np.zeros((width), dtype=np.uint8)
    line_pointer = np.zeros((width), dtype=np.uint8)
    for col in range(width):
    for row in range(height):
    if rectangle_meter[row, col] == SEG_LABEL['pointer']:
    line_pointer[col] += 1
    elif rectangle_meter[row, col] == SEG_LABEL['scale']:
    line_scale[col] += 1
    line_scales.append(line_scale)
    line_pointers.append(line_pointer)
    return line_scales, line_pointers


def mean_binarization(data_list):
    """
    Binarize the data

    Param:
        data_list (list[np.array]):input data

    Return:
        binaried_data_list (list[np.array]):output data。

    """
    batch_size = len(data_list)
    binaried_data_list = data_list
    for i in range(batch_size):
    mean_data = np.mean(data_list[i])
    width = data_list[i].shape[0]
    for col in range(width):
    if data_list[i][col] < mean_data:
    binaried_data_list[i][col] = 0
    else:
    binaried_data_list[i][col] = 1
    return binaried_data_list


def locate_scale(line_scales):
    """
    Find location of center of each scale

    Param:
        line_scales (list[np.array]):the list of binaried scales value

    Return:
        scale_locations (list[list]):location of each scale

    """
    batch_size = len(line_scales)
    scale_locations = list()
    for i in range(batch_size):
    line_scale = line_scales[i]
    width = line_scale.shape[0]
    find_start = False
    one_scale_start = 0
    one_scale_end = 0
    locations = list()
    for j in range(width - 1):
    if line_scale[j] > 0 and line_scale[j + 1] > 0:
    if not find_start:
    one_scale_start = j
    find_start = True
    if find_start:
    if line_scale[j] == 0 and line_scale[j + 1] == 0:
    one_scale_end = j - 1
    one_scale_location = (one_scale_start + one_scale_end) / 2
    locations.append(one_scale_location)
    one_scale_start = 0
    one_scale_end = 0
    find_start = False
    scale_locations.append(locations)
    return scale_locations


def locate_pointer(line_pointers):
    """
    Find location of center of pointer

    Param:
        line_scales (list[np.array]):the list of binaried pointer value

    Return:
        scale_locations (list[list]):location of pointer

    """
    batch_size = len(line_pointers)
    pointer_locations = list()
    for i in range(batch_size):
    line_pointer = line_pointers[i]
    find_start = False
    pointer_start = 0
    pointer_end = 0
    location = 0
    width = line_pointer.shape[0]
    for j in range(width - 1):
    if line_pointer[j] > 0 and line_pointer[j + 1] > 0:
    if not find_start:
    pointer_start = j
    find_start = True
    if find_start:
    if line_pointer[j] == 0 and line_pointer[j + 1] == 0 :
    pointer_end = j - 1
    location = (pointer_start + pointer_end) / 2
    find_start = False
    break
    pointer_locations.append(location)
    return pointer_locations


def get_relative_location(scale_locations, pointer_locations):
    """
    Match location of pointer and scales

    Param:
        scale_locations (list[list]):location of each scale
        pointer_locations (list[list]):location of pointer

    Return:
        pointed_scales (list[dict]): a list of dict with:
                                     'num_scales': total number of scales
                                     'pointed_scale': predicted number of scales

    """
    pointed_scales = list()
    for scale_location, pointer_location in zip(scale_locations,
    pointer_locations):
    num_scales = len(scale_location)
    pointed_scale = -1
    if num_scales > 0:
    for i in range(num_scales - 1):
    if scale_location[i] <= pointer_location < scale_location[i + 1]:
    pointed_scale = i + (pointer_location - scale_location[i]) / (scale_location[i + 1] - scale_location[i] + 1e-05) + 1
    result = {'num_scales': num_scales, 'pointed_scale': pointed_scale}
    pointed_scales.append(result)
    return pointed_scales


def calculate_reading(pointed_scales):
    """
    Calculate the value of meter according to the type of meter

    Param:
        pointed_scales (list[list]):predicted number of scales

    Return:
        readings (list[float]): the list of values read from meter

    """
    readings = list()
    batch_size = len(pointed_scales)
    for i in range(batch_size):
    pointed_scale = pointed_scales[i]
    # find the type of meter according the total number of scales
    if pointed_scale['num_scales'] > TYPE_THRESHOLD:
    reading = pointed_scale['pointed_scale'] * METER_CONFIG[0]['scale_interval_value']
    else:
    reading = pointed_scale['pointed_scale'] * METER_CONFIG[1]['scale_interval_value']
    readings.append(reading)
    return readings
メイン関数
モデルとパラメーターを初期化
OpenVINO を使用して推論を実行するためにドロップダウン・リストからデバイスを選択します。
import ipywidgets as widgets

device = widgets.Dropdown(
    options=core.available_devices + ["AUTO"],
    value='AUTO',
    description='Device:',
    disabled=False,
)

device
Dropdown(description='Device:', index=1, options=('CPU', 'AUTO'), value='AUTO')
検出ネットワークから検出されるメーターの数は、シナリオによって任意である可能性があります。つまり、セグメント化ネットワーク入力のバッチサイズは動的次元であり、静的次元に使用される正の数ではなく -1 または ov::Dimension() として指定する必要があります。この場合、メモリー消費を最適化するため、入力バッチサイズの下限および上限を指定できます。
img_file = f"{DATA_DIR}/{IMG_FILE_NAME}"
det_model_path = f"{MODEL_DIR}/meter_det_model/model.pdmodel"
det_model_shape = {'image': [1, 3, 608, 608], 'im_shape': [1, 2], 'scale_factor': [1, 2]}
seg_model_path = f"{MODEL_DIR}/meter_seg_model/model.pdmodel"
seg_model_shape = {'image': [ov.Dimension(1, 2), 3, 512, 512]}
erode_kernel = 4
score_threshold = 0.5
seg_batch_size = 2
input_shape = 608
# Intialize the model objects
detector = Model(det_model_path, det_model_shape, device.value)
segmenter = Model(seg_model_path, seg_model_shape, device.value)
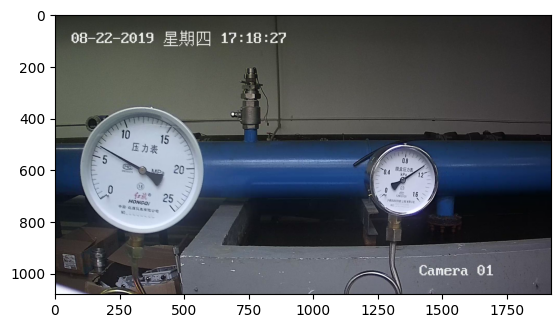
# Visulize a original input photo
image = cv2.imread(img_file)
rgb_image = cv2.cvtColor(image, cv2.COLOR_BGR2RGB)
plt.imshow(rgb_image)
<matplotlib.image.AxesImage at 0x7f476c1d6fd0>
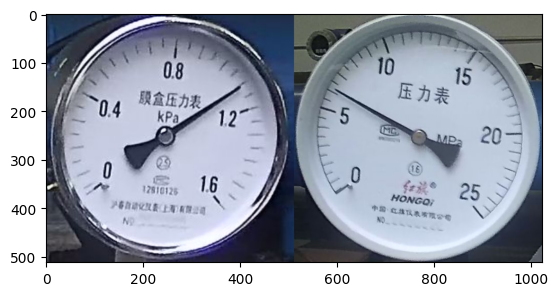
メーター検出モデルの実行
メーターの位置を検出し、セグメント化用の ROI 画像を準備します。
# Prepare the input data for meter detection model
im_shape = np.array([[input_shape, input_shape]]).astype('float32')
scale_factor = np.array([[1, 2]]).astype('float32')
input_image = det_preprocess(image, input_shape)
inputs_dict = {'image': input_image, "im_shape": im_shape, "scale_factor": scale_factor}

# Run meter detection model
det_results = detector.predict(inputs_dict)

# Filter out the bounding box with low confidence
filtered_results = filter_bboxes(det_results, score_threshold)

# Prepare the input data for meter segmentation model
scale_x = image.shape[1] / input_shape * 2
scale_y = image.shape[0] / input_shape

# Create the individual picture for each detected meter
roi_imgs, loc = roi_crop(image, filtered_results, scale_x, scale_y)
roi_imgs, resize_imgs = roi_process(roi_imgs, METER_SHAPE)

# Create the pictures of detection results
roi_stack = np.hstack(resize_imgs)

if cv2.imwrite(f"{DATA_DIR}/detection_results.jpg", roi_stack):
    print("The detection result image has been saved as \"detection_results.jpg\" in data")
    plt.imshow(cv2.cvtColor(roi_stack, cv2.COLOR_BGR2RGB))
The detection result image has been saved as "detection_results.jpg" in data
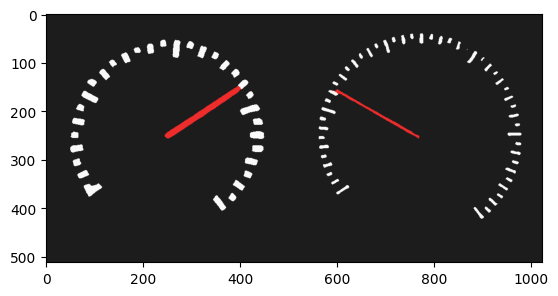
メーターセグメント化モデルの実行
検出された ROI に対するセグメント化タスクの結果を取得します。
seg_results = list()
mask_list = list()
num_imgs = len(roi_imgs)

# Run meter segmentation model on all detected meters
for i in range(0, num_imgs, seg_batch_size):
    batch = roi_imgs[i : min(num_imgs, i + seg_batch_size)]
    seg_result = segmenter.predict({"image": np.array(batch)})
    seg_results.extend(seg_result)
results = []
for i in range(len(seg_results)):
    results.append(np.argmax(seg_results[i], axis=0))
seg_results = erode(results, erode_kernel)

# Create the pictures of segmentation results
for i in range(len(seg_results)):
    mask_list.append(segmentation_map_to_image(seg_results[i], COLORMAP))
mask_stack = np.hstack(mask_list)

if cv2.imwrite(f"{DATA_DIR}/segmentation_results.jpg", cv2.cvtColor(mask_stack, cv2.COLOR_RGB2BGR)):
    print("The segmentation result image has been saved as \"segmentation_results.jpg\" in data")
    plt.imshow(mask_stack)
The segmentation result image has been saved as "segmentation_results.jpg" in data
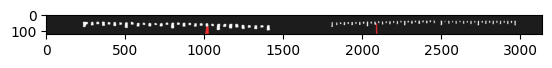
モデルの結果を後処理し最終的な読み取り値を計算
OpenCV 関数を使用して、スケールマップ内のポインターの位置を見つけます。
# Find the pointer location in scale map and calculate the meters reading
rectangle_meters = circle_to_rectangle(seg_results)
line_scales, line_pointers = rectangle_to_line(rectangle_meters)
binaried_scales = mean_binarization(line_scales)
binaried_pointers = mean_binarization(line_pointers)
scale_locations = locate_scale(binaried_scales)
pointer_locations = locate_pointer(binaried_pointers)
pointed_scales = get_relative_location(scale_locations, pointer_locations)
meter_readings = calculate_reading(pointed_scales)

rectangle_list = list()
# Plot the rectangle meters
for i in range(len(rectangle_meters)):
    rectangle_list.append(segmentation_map_to_image(rectangle_meters[i], COLORMAP))
rectangle_meters_stack = np.hstack(rectangle_list)

if cv2.imwrite(f"{DATA_DIR}/rectangle_meters.jpg", cv2.cvtColor(rectangle_meters_stack, cv2.COLOR_RGB2BGR)):
    print("The rectangle_meters result image has been saved as \"rectangle_meters.jpg\" in data")
    plt.imshow(rectangle_meters_stack)
The rectangle_meters result image has been saved as "rectangle_meters.jpg" in data
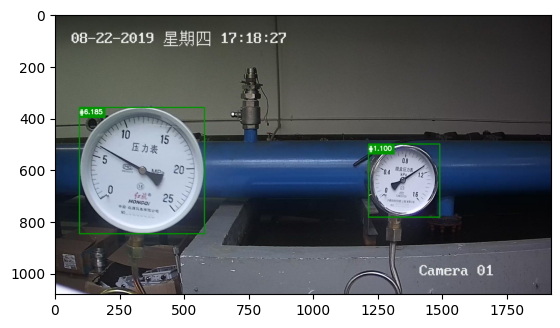
メーターの画像で読み取り結果を取得
# Create a final result photo with reading
for i in range(len(meter_readings)):
    print("Meter {}: {:.3f}".format(i + 1, meter_readings[i]))

result_image = image.copy()
for i in range(len(loc)):
    cv2.rectangle(result_image,(loc[i][0], loc[i][1]), (loc[i][2], loc[i][3]), (0, 150, 0), 3)
    font = cv2.FONT_HERSHEY_SIMPLEX
    cv2.rectangle(result_image, (loc[i][0], loc[i][1]), (loc[i][0] + 100, loc[i][1] + 40), (0, 150, 0), -1)
    cv2.putText(result_image, "#{:.3f}".format(meter_readings[i]), (loc[i][0],loc[i][1] + 25), font, 0.8, (255, 255, 255), 2, cv2.LINE_AA)
if cv2.imwrite(f"{DATA_DIR}/reading_results.jpg", result_image):
    print("The reading results image has been saved as \"reading_results.jpg\" in data")
    plt.imshow(cv2.cvtColor(result_image, cv2.COLOR_BGR2RGB))
Meter 1: 1.100
Meter 2: 6.185
The reading results image has been saved as "reading_results.jpg" in data