Hello オブジェクト検出#
この Jupyter ノートブックはオンラインで起動でき、ブラウザーのウィンドウで対話型環境を開きます。ローカルにインストールすることもできます。次のオプションのいずれかを選択します:
OpenVINO™ でオブジェクト検出モデルを使用する非常に基本的な入門編です。
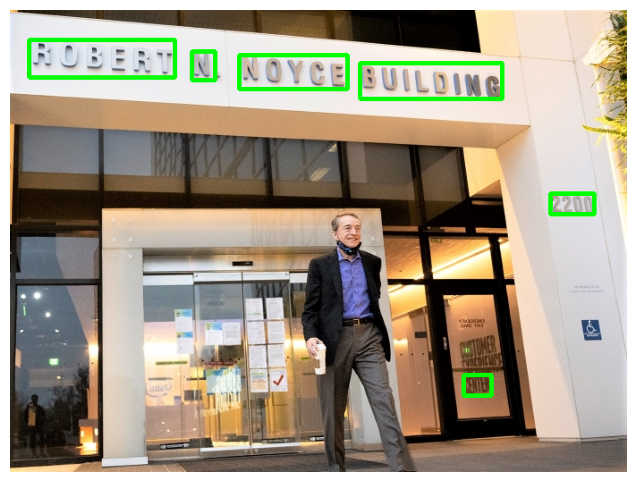
Open Model Zoo の horizontal-text-detection-0001 モデルが使用されます。画像内の横書きテキストを検出し、[100, 5] 形状のデータのブロブを返します。検出された各テキストボックスは [x_min, y_min, x_max, y_max, conf] 形式で保存されます。ここで、(x_min, y_min) は境界ボックスの左上隅の座標、(x_max, y_max) は境界ボックスの右下隅の座標です。右境界ボックスの隅と conf は、予測されたクラスの信頼度です。
目次:
# openvino パッケージをインストール
%pip install -q "openvino>=2023.1.0" opencv-python tqdm
Note: you may need to restart the kernel to use updated packages.インポート#
import cv2
import matplotlib.pyplot as plt
import numpy as np
import openvino as ov
from pathlib import Path

# `notebook_utils` モジュールを取得
import requests

r = requests.get(

url="https://raw.githubusercontent.com/openvinotoolkit/openvino_notebooks/latest/utils/notebook_utils.py",
)

open("notebook_utils.py", "w").write(r.text)

from notebook_utils import download_fileモデルの重みをダウンロード#
base_model_dir = Path("./model").expanduser()

model_name = "horizontal-text-detection-0001"
model_xml_name = f"{model_name}.xml"
model_bin_name = f"{model_name}.bin"

model_xml_path = base_model_dir / model_xml_name
model_bin_path = base_model_dir / model_bin_name

if not model_xml_path.exists():
    model_xml_url =
"https://storage.openvinotoolkit.org/repositories/open_model_zoo/2022.3/models_bin/1/horizontal-text-detection-0001/FP32/horizontal-text-detection-0001.xml"
    model_bin_url =
"https://storage.openvinotoolkit.org/repositories/open_model_zoo/2022.3/models_bin/1/horizontal-text-detection-0001/FP32/horizontal-text-detection-0001.bin"

    download_file(model_xml_url, model_xml_name, base_model_dir)
    download_file(model_bin_url, model_bin_name, base_model_dir)
else:
    print(f"{model_name} already downloaded to {base_model_dir}")
model/horizontal-text-detection-0001.xml: 0%| | 0.00/680k [00:00<?, ?B/s]model/horizontal-text-detection-0001.bin: 0%| | 0.00/7.39M [00:00<?, ?B/s]推論デバイスの選択#
OpenVINO を使用して推論を実行するためにドロップダウン・リストからデバイスを選択します
import ipywidgets as widgets

core = ov.Core()
device = widgets.Dropdown(
    options=core.available_devices + ["AUTO"],
    value="AUTO",
    description="Device:",
    disabled=False,
)

deviceDropdown(description='Device:', index=1, options=('CPU', 'AUTO'), value='AUTO')モデルのロード#
core = ov.Core()

model = core.read_model(model=model_xml_path)
compiled_model = core.compile_model(model=model, device_name=device.value)

input_layer_ir = compiled_model.input(0)
output_layer_ir = compiled_model.output("boxes")画像のロード#
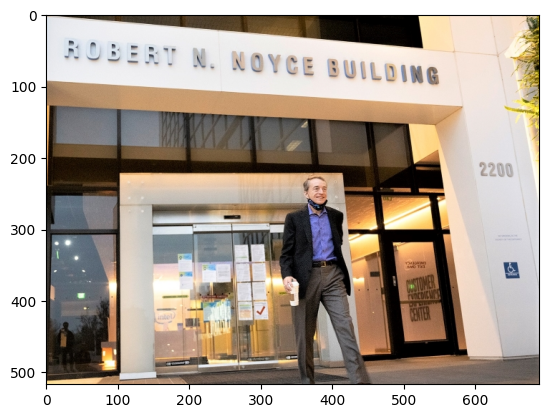
# openvino_notebooks ストレージからイメージをダウンロード
image_filename = download_file(

"https://storage.openvinotoolkit.org/repositories/openvino_notebooks/data/data/image/intel_rnb.jpg",
    directory="data",
)

# テキスト検出モデルでは、BGR 形式の画像が必要
image = cv2.imread(str(image_filename))

# N,C,H,W = バッチサイズ、チャネル数、高さ、幅。N, C, H, W = input_layer_ir.shape

# ネットワークの予想される入力サイズに合わせて画像のサイズを変更
resized_image = cv2.resize(image, (W, H))

# ネットワーク入力の形状に合わせて形状を変更
input_image = np.expand_dims(resized_image.transpose(2, 0, 1), 0)

plt.imshow(cv2.cvtColor(image, cv2.COLOR_BGR2RGB));
data/intel_rnb.jpg: 0%| | 0.00/288k [00:00<?, ?B/s]
推論の実行#
# 推論リクエストを作成
boxes = compiled_model([input_image])[output_layer_ir]

# ゼロのみのボックスを削除
boxes = boxes[~np.all(boxes == 0, axis=1)]結果を可視化#
# 各検出の説明は [x_min, y_min, x_max, y_max, conf] の形式です:
# ここで渡される画像は、幅と高さが変更された BGR 形式です。Matplotlib が期待する色で表示するには、cvtColor 関数を使用
def convert_result_to_image(bgr_image, resized_image, boxes, threshold=0.3, conf_labels=True):
    # ボックスと説明の色を定義
    colors = {"red": (255, 0, 0), "green": (0, 255, 0)}

    # 画像の形状を取得して比率を計算
    (real_y, real_x), (resized_y, resized_x) = (
        bgr_image.shape[:2],
        resized_image.shape[:2],
    )
    ratio_x, ratio_y = real_x / resized_x, real_y / resized_y

    # ベース画像を BGR 形式から RGB 形式に変換
    rgb_image = cv2.cvtColor(bgr_image, cv2.COLOR_BGR2RGB)

    # ゼロ以外のボックスを反復処理
    for box in boxes:
        # 配列の最後の場所から信頼係数を選択
        conf = box[-1]
        if conf > threshold:
            # loat を int に変換し、各ボックスのコーナーの位置に x と y の比率を掛ける。
            # 境界ボックスが画像の上部にある場合は、
            # 画像上に表示されるように上部のボックスバーを少し下に配置
            (x_min, y_min, x_max, y_max) = [
                (int(max(corner_position * ratio_y, 10)) if idx % 2 else int(corner_position * ratio_x)) for idx, corner_position in enumerate(box[:-1])
            ]

            # 位置に基づいてボックスを描画します。長方形関数のパラメーターは、image、start_point、end_point、color、thickness です。
            rgb_image = cv2.rectangle(rgb_image, (x_min, y_min), (x_max, y_max), colors["green"], 3)

            # 位置と信頼度に基づいて画像にテキストを追加します。
            # テキスト関数のパラメーターは、image、text、bottom-left_corner_textfield、font、font_scale、color、thickness、line_type です。
            if conf_labels:
                rgb_image = cv2.putText(
                    rgb_image,
                    f"{conf:.2f}",
                    (x_min, y_min - 10),
                    cv2.FONT_HERSHEY_SIMPLEX,
                    0.8,
                    colors["red"],
                    1,
                    cv2.LINE_AA,
            )

return rgb_imageplt.figure(figsize=(10, 6))
plt.axis("off")
plt.imshow(convert_result_to_image(image, resized_image, boxes, conf_labels=False));